One and Another State of Yellow
From the Monument
February 13, 2016artist contribution,
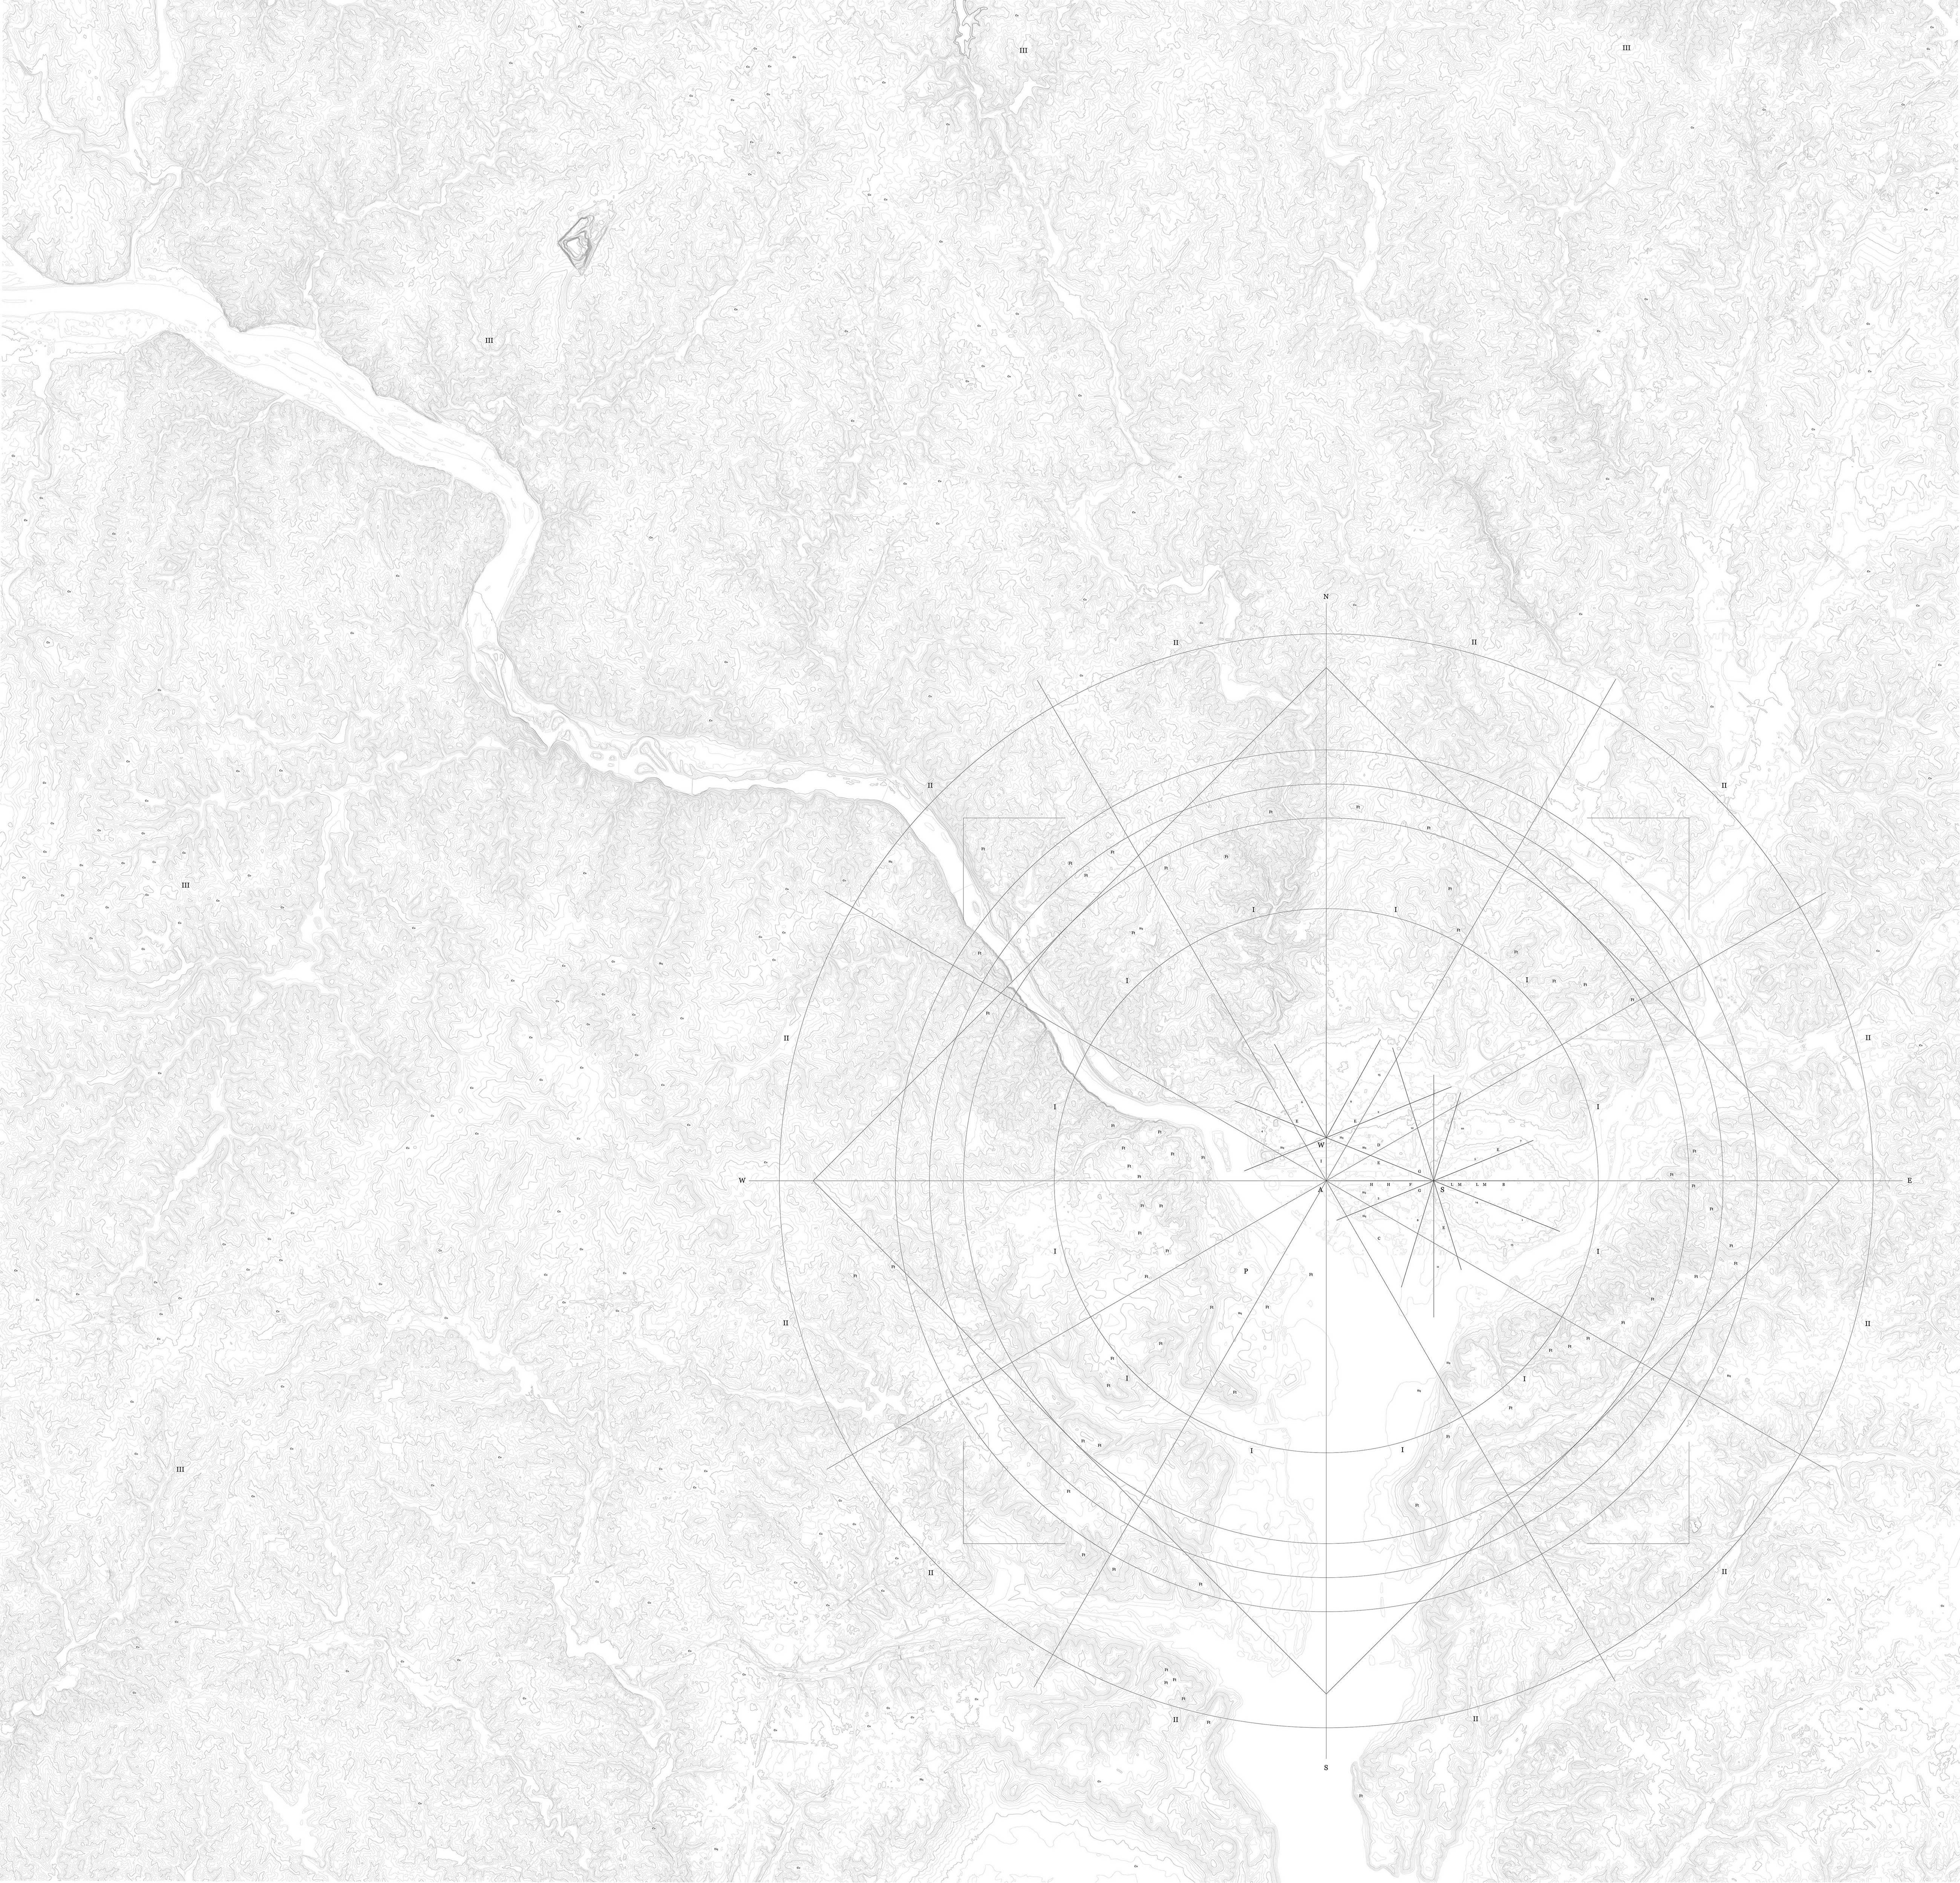
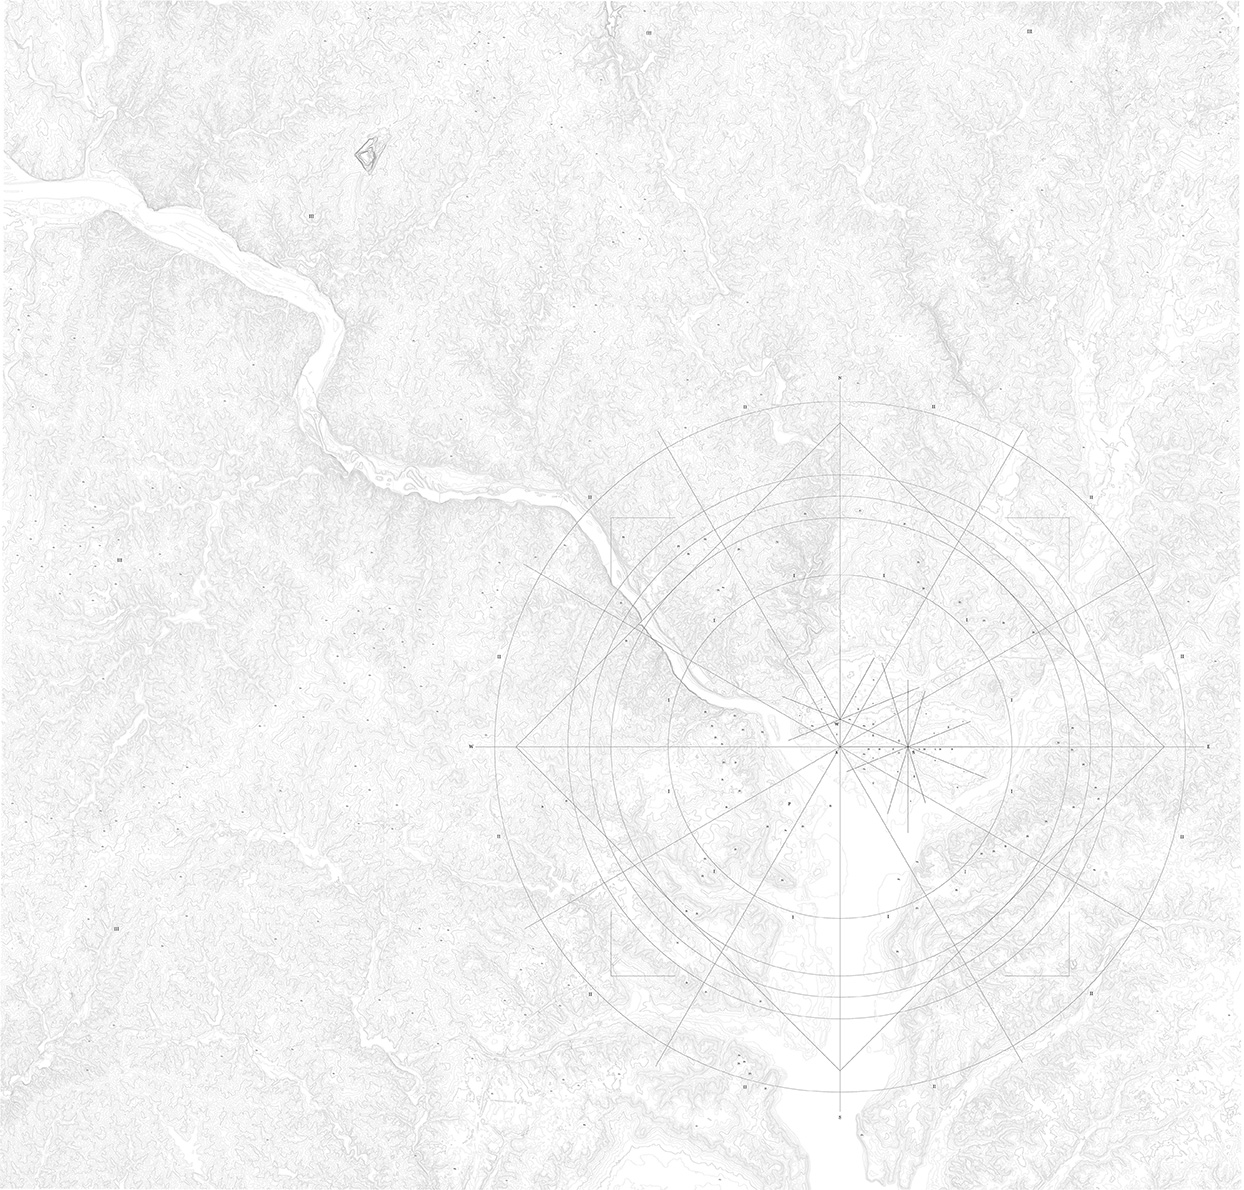
The art project One and Another State of Yellow (2013–2016) studies the interplay between architecture and urban planning, ideologies and psychological warfare around two landscapes of ‘war’ in the US: 1) the urban military experiment El Paso-Juárez at the United States-Mexico border; and 2) Washington, DC as the US war and control apparatus. El Paso is an American city that borders directly on Ciudad Juárez, Mexico. In 2010 Juárez was listed as the deadliest city in the world. At the same time El Paso was listed as the safest city in the US. Washington DC can be seen as the big overall political ‘constructor’ and ‘producer’ of the landscape of war. The work questions the ways in which architecture and urban planning are strategically employed – as psychological warfare strategies, that is, propaganda, military deception, perception management – to threaten or stimulate fear, or even to deceive an audience or enemy. One and Another State of Yellow consists of a photographic installation of the Mount Cristo Rey foothills in El Paso, and a cartographic work of greater Washington DC that takes up an entire wall.
For this digital version the carthography is accompanied by the text work From the Monument, a script for voice over. The text is based on a collection of literature, newspaper and magazine articles, from amongst others LIFE, TIME and Collier’s, and descriptions of urban plans and systems. Written from an urban planning perspective on the one hand (narrator I) and from a strategic planning perspective on the other hand (narrator II), it brings together various urban plans and systems based on urban planning ideologies as well as hidden military agendas. The two perspectives almost overlap, but the differences between narrator I and narrator II (both clickable) are subtle and significant.
[NO OVERLAY]
|
'A good propagandist knows how to shape opinion by manipulating maps. Political persuasion often concerns territorial claims, nationalities, national pride, borders, strategic positions, conquests, attacks, troop movements, defences, spheres of influence, regional inequality, and other geographic phenomena conveniently portrayed cartographically. The propagandist molds the map’s message by emphasizing supporting features, suppressing contradictory information, and choosing provocative, dramatic symbols.'
[Mark Monmonier, How To Lie With Maps, 1996, 87]
'Maps can even make nuclear war appear survivable. The specter of nuclear warfare sends threatened nations and pacifists worldwide to the cartographic arsenal for an honoured piece of geopolitical ordnance, the circle. Diplomats and military strategists have found the circle particularly useful in showing the striking zones of aircraft, and modern strategists find circles indispensable when discussing the range of missiles. Circles bring to the map a geometric purity easily mistaken for accuracy and authority.'
[Ibid., 109]
Radius I
[‘The L’Enfant Plan’, Pierre Charles L’Enfant, 1791, Library of Congress, Washington, DC, 88694195]
In 1791, eight years after the end of the American Revolutionary War, plans originated for a new capital of the United States of America. At the intersection of the Potomac and Anacostia rivers, partly on Maryland and partly on Virginia territory, the landscape for the City of Washington, District of Colombia, began to evolve.
Architect and military engineer Pierre Charles L’Enfant envisioned the plan for the capital city of Washington, DC. L’Enfant proposed a system of wide lanes, grand vistas and a series of squares and circles to represent the nation’s values of freedom and democracy – and its military power. Two grids were superimposed, one with streets running North-South and East-West, and a second with diagonal avenues named after the states. At intersecting points, within line of sight of each one, fifteen circles and squares were defined, containing monuments, statues and obelisks.
The plan consisted of three main points A, S and W, each one referring to an aspect of political power. Point A can be perceived to be the point of origin of the plan. It was to hold the statue of President George Washington, in whose honour the capital was named. Point S, situated on a hill one mile east of point A, was to represent the seat of government, the capital. From here the North-South, East-West street grid was divided into four quadrants. The line from point A to S was intended as the main axis, the National Mall. This axis was to represent the nation’s ideology, political power and heroism.
From a mathematical perspective, point A can be perceived as the orthocentre of a triangle ASW with point W as the White House. From points S and W, situated on higher ground, two sets of radiating lanes were laid out offering grand vistas far into the capital’s borderlands.
At about a five-mile radius [I] from the capital city’s point of origin [A], a circle of hills encompasses the capital’s territory. From this pastoral landscape commanding views reached deep into the capital’s structure.
Radius I
[‘The L’Enfant Plan,’ Pierre Charles L’Enfant, 1791, Library of Congress, Washington, DC, 88694195]
In 1791, eight years after the end of the American Revolutionary War, plans originated for a new capital of the United States of America. At the intersection of the Potomac and Anacostia rivers, partly on Maryland and partly on Virginia territory, the landscape for the City of Washington, District of Colombia, began to evolve.
Architect and military engineer Pierre Charles L’Enfant envisioned the plan for the capital city of Washington, DC. L’Enfant proposed a system of wide lanes, grand vistas and a series of squares and circles to represent the nation’s values of freedom and democracy – and its military power. Two grids were superimposed, one with streets running North-South and East-West, and a second with diagonal avenues to control the capital’s territory. At intersecting points, within line of sight of each one, fifteen circles and squares were defined, based on military needs.
The plan consisted of three central points A, S and W, each one referring to an aspect of military power. Point A can be perceived to be the point of origin of the plan. It was to hold the 1884 Washington Monument, which can be viewed as the capital’s central panoptical viewpoint. Point S, situated on a hill one mile east of point A, was to represent the seat of government, the capital. In case of military threat this point would serve to control the surrounding territory and command all approaches. The line from point A to S was intended as the main axis, the National Mall. This axis was to represent the nation’s ideology, military power and heroism.
From a mathematical perspective, point A can be perceived as the orthocentre of a triangle ASW with point W as the White House. From points S and W, situated on higher ground, two sets of radiating lanes were laid out, offering panoptical views far into the capital’s borderlands.
At about a five-mile radius [I] from the capital city’s point of origin [A], a circle of hills encompasses the capital’s territory. In 1865, at the end of the Civil War, in this pastoral landscape, the 'World’s Greatest Earthworks Protected Capital' appeared.
Radius II
[The Yellow Book, 1955, United States Bureau of Public Roads, Library of Congress, Washington DC, 55063360]
In the 1950s, the early days of the Cold War, the pastoral landscape bordering the capital city of Washington, District of Columbia, began being molded into a logic of highway schemes and dispersal diagrams. Around the initial borders of the city, laid out as a parallelogram, plans were drafted for a circumferential road system.
In 1955 the Bureau of Public Roads published The Yellow Book, a plan for an Interstate Highway System, which eventually led to the Federal Highway Act of 1956. The act, calling for 41,000 miles of highways and metropolitan circle systems, was a response to the needs of suburban growth, as well as civilian and military defence.
At about a ten-mile radius [II] from the capital city’s point of origin [A], a Capital Circle Road was proposed. This sixty-four-mile structure, crossing the states of Maryland and Virginia, was to facilitate the capital’s flow of economic and suburban growth. From the point of origin, a series of radiating lines was conceived, reaching far into the pastoral borderlands. Along the capital’s circle and lines, and at its intersections, dispersal of industry and government entities was to occur.
When superimposed over the 1898 Garden City diagram by the social reformer Ebenezer Howard, early Cold War Washington, DC can be perceived to show the diagram’s 'correct principle of a city’s growth – open country ever near at hand and rapid communication between off-shoots.' Howard’s utopian concept combined the best of city and rural life. The diagram consisted of a central city as the point of origin, a surrounding circle to be the high road and a number of radiating avenues connecting them. At the intersections of the city’s circle and radials, smaller concentric subcentres were conceived. Another set of concentric circles divided the diagram into green belts, service areas and buffer zones. The model could be extended endlessly congruent to economic and suburban growth.
Radius II
[The Yellow Book, 1955, United States Bureau of Public Roads, Library of Congress, Washington DC, 55063360]
In the 1950s, the early days of the Cold War, the pastoral landscape bordering the capital city of Washington, District of Columbia, began being molded into a logic of highway schemes and dispersal diagrams. Around the initial borders of the city, laid out as a parallelogram, plans were drafted for a circumferential road system.
In 1955 the Bureau of Public Roads published The Yellow Book, a plan for an Interstate Highway System, which eventually led to the Federal Highway Act of 1956. The act, calling for 41,000 miles of highways and metropolitan circle systems, was a response to the needs of suburban growth, as well as civilian and military defence.
At about a ten-mile radius [II] from the capital city’s point of origin [A], a Capital Circle Road was proposed. This sixty-four-mile structure, crossing the states of Maryland and Virginia, was to serve military needs and evacuation purposes in the event of a nuclear attack. A thermonuclear detonation diameter was calculated to mark the outline of the capital circle. From the point of origin, a series of radiating lines was conceived, pursuant to civilian defence dispersal theories.
When superimposed over the 1950 Civilian Defense Plan by the mathematician Norbert Wiener, early Cold War Washington, DC can be perceived as an American model city in times of both peace and war. Wiener’s concept was conceived to increase awareness of the New Atomic Age and communist threat. In the event of a nuclear attack on a targeted city, the model was meant to serve as a transportation, communication and evacuation system. The plan consisted of a city centre as the point of origin, a surrounding circle to be a highway life belt, and a number of radiating avenues connecting them. Another set of concentric circles divided the plan into safety belts, service areas and buffer zones. The model could be applied endlessly congruent to communist threat and nuclear danger.
Radius III
[One Map, 2005, National Geospatial Intelligence Agency, for Official Use Only]
In the early 2000s, with the initiation of the 'War on Terror,' greater Washington, DC became the manifestation of a new urban landscape. As twenty-first-century cities increasingly became targets and sources of threats, fear, risk and control, the capital city of Pierre Charles L’Enfant started to transition into a landscape of psychological warfare.
In 2005, the US government initiated the One Map project. As a response to the needs of the Department of Defense and Department of Homeland Security, the project involved the collection and analysis of information from every critical point of North America territory. The map was to be used as a tool for threat analysis and emergency preparedness. A major focus was the twenty-first century city as the War on Terror’s new battlefield – and especially greater Washington, DC.
Some forty years earlier, at about a fifteen-mile radius [III] from the capital city’s point of origin [A] a greater Washington, DC circle road was proposed, to access a growing number of large economic entities, called Edge Cities. Although the circle road was never realised, its circumference can be considered the main structure for a twenty-first-century spatial system for defence and security industries. Extending outward from Maryland and Virginia to the pastoral borderlands of greater Washington, DC, the system can be perceived to manage the American perception of risk and threat.
From the triangle PSW – Pentagon, Capitol Hill and White House – with point P as its reference point, a network of information and intelligence headquarters [Hq], and contractors [Co] is laid out. Within the system of lines and dots, the headquarters can be considered the constructors of risk and threat, while the contractors are the producers. A new economy evolves alongside the spatial system.
Radius III
[One Map, 2005, National Geospatial Intelligence Agency, for Official Use Only]
In the early 2000s, with the initiation of the 'War on Terror,' greater Washington, DC became the manifestation of a new urban landscape. As twenty-first-century cities increasingly became targets and sources of threats, fear, risk and control, the capital city of Pierre Charles L’Enfant started to transition into a landscape of psychological warfare.
In 2005, the US government initiated the One Map project. As a response to the needs of the Department of Defense and Department of Homeland Security, the project involved the collection and analysis of information from every critical point of North America territory. The map was to be used as a tool for threat analysis and emergency preparedness. A major focus was the twenty-first-century city as the War on Terror’s new battlefield – and especially Greater Washington, DC.
Some forty years earlier, at about a fifteen-mile radius [III] from the capital city’s point of origin [A] a greater Washington, DC circle road was proposed, to access a growing number of large economic entities, called Edge Cities. Although the circle road was never realised, its circumference can be considered the main structure for a twenty-first-century spatial system of information warfare. Extending outward from the states of Maryland and Virginia to the pastoral borderlands of greater Washington, DC, the system can be seen as a concept for urban military deception.
From the triangle PSW – Pentagon, Capitol Hill and White House – with point P as its reference point, a network of information and intelligence headquarters [Hq], and companies [Co] is laid out. Within the system of lines and dots, the headquarters can be considered the offices of deception, while the companies are its duplications. A landscape of psychological warfare evolves alongside the spatial system.
[NO OVERLAY] Overview Map
Further References
- ‘Planned Secure City,’ Washington Post, 19 August 1917
- ‘Capitol’s Defense,’ Los Angeles Times, 9 November 1920
- ‘World’s Greatest Earthworks Protected Capital,’ Sunday Washington Star, 1 March 1931
- ‘Model Atom Defense Plan Set for DC,’ Washington Post, 23 May 1950
- ‘35,000 Killed as A-Bomb Hits Clinton Sq.,’ Syracuse Herald-Journal, Civil Defense Test Issue, 27 November 1952
- ‘203,000 Killed as A-Bomb Hits Bronx; County Is Rushing Aid,‘ Reporter Dispatch, Daily Item, Citizen Register, Daily Argus, Daily Times, Standard-Star, Daily News, Herald Statesman, Civil Defense Test Edition, 13 December 1952
- ‘A-Bomb Destroys Downtown Buffalo. 40,000 Killed,’ Buffalo Evening News, Civil Defense Test Issue, 27 September 1952
- Martin Manning, Historical Dictionary of American Propaganda, Westport, CT, and London: Greenwood Press, 2004
- Spiro Kostof, The City Shaped: Urban Patterns and Meanings Through History, London: Thames & Hudson, 1991
- Stephen Graham, Cities Under Siege: The New Military Urbanism, London and New York: Verso, 2011
- Matthew Farish, The Contours of America’s Cold War, Minneapolis: University of Minnesota Press, 2010
- Dana Priest and William M. Arkin, Top Secret America: The Rise of the New American Security State, New York: Back Bay Books / Little, Brown and Company, 2011
- Kirk Savage, Monument Wars: Washington, D.C., the National Mall, and the Transformation of the Memorial Landscape, Berkeley and Los Angeles: University of California Press, 2009
- Scott Gerwehr and Russell W. Glenn, The Art of Darkness: Deception and Urban Operations, Santa Monica, CA and Washington, DC: Rand Corporation, 2000
- Federal Civil Defense Administration, Civil Defense Urban Analysis: Technical Manual 8–1, Washington, DC: United States Government Printing Office, July 1953
- ‘How U.S. Cities Can Prepare of Atomic War,’ LIFE, 18 December 1950
- The American Institute of Planners, 'Defense Considerations in City Planning,' Bulletin of the Atomic Scientists, September 1953
- ‘The City of Washington and an Atomic Attack,’ Bulletin of the Atomic Scientists, January 1950
- Tracy B. Augur, 'The Dispersal of Cities as a Defense Measure,' Bulletin of the Atomic Scientists, May 1948
- Deborah Natsios, 'National Security Sprawl: Washington DC,' David Grahame Shane, Brian McGrath (ed.), Architectural Design: Sensing the 21st Century City: Close Up and Remote, October 2005
Elian Somers (Sprang-Capelle, 1975) lives and works in Rotterdam. She completed her Master in Architecture at the Delft University of Technology and her Master in Photography at AKV St. Joost in Breda. In her long-term projects she questions the utopian urban landscape and the ways its ideological foundations and (virtual) histories are manifested and interpreted. Her works have been shown at various exhibitions, amongst others Border Theories (solo) at Stedelijk Museum Bureau Amsterdam (2013), Between the Map and the Territory at TENT, Rotterdam (2012) and Learning from… Rotterdam at Kunsthalle Wilhelmshaven (2012). In 2013 the book Border Theories was launched.